
Here's an illuminating research study that was presented at a major European conference in September, 2006. It reports on the daily pattern of blood sugars of a group of normal subjects as revealed by continuous blood sugar monitoring. It gives a very solid answer to the question, "What is a normal blood sugar?"
What is Normal Glucose? – Continuous Glucose Monitoring Data from Healthy Subjects. Professor J.S. Christiansen, presented at the Annual Meeting of the EASD.
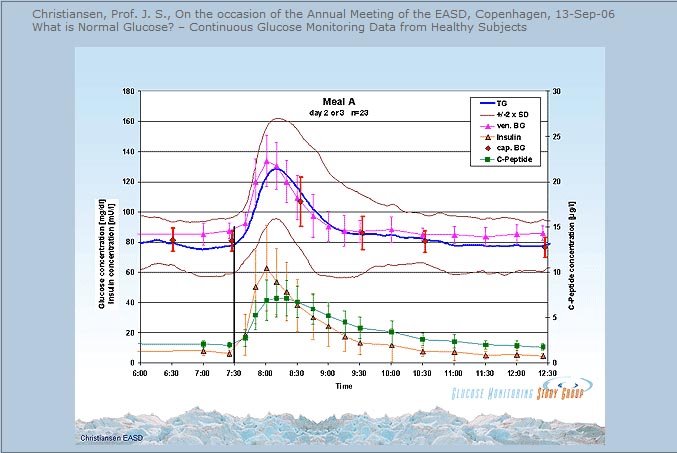
Above is a very revealing graph screen-captured from the dynamic display of this presentation. Click on the image to enlarge it so you can read it better.
It shows analysis of data from a study of normal people's blood sugars after a high carbohydrate breakfast eaten at 7:30 AM. The blue line is the average for the group. The brown lines are the readings for the people with the highest and lowest individual values which very possibly are those with the highest (5.4%) and lowest (4.3%) A1Cs.
The main findings here, for those of you who don't have the high speed internet connection needed to listen to this presentation, is that in normal people fasting blood glucose throughout the night stays flat in the low 80 mg/dl (4.4 mmol/L) range. After a high carb meal, blood sugar rises to about 125 mg/dl for a brief period, with the peak blood sugar being measured at 45 minutes after eating. The chart at the top of this page is taken from this presentation. Notice that in all but the people with the highest A1cs, blood sugar is under 100 mg/dl (5.5 mmol/L) at 1 hour and 15 minutes after eating and it returns to 85 mg/dl (4.7 mmol/L) by 1 hour and 45 minutes after eating.
Note also, how much lower even the highest of these normal readings are than the ADA's diagnostic cutoff for "impaired glucose tolerance" which is 140 mg/dl two hours after eating!
A few people in the study went as high as 160 mg/dl (8.9 mmol/L) after the high carb meal, which may be because they are not entirely normal. The study most likely recruited normal subjects based on their A1cs and the highest values in the group went up to 5.4% which is compatible with very early deterioration in first phase insulin secretion.
This study also documents that eating a high carb meal for breakfast results in an unacceptably high blood sugar swing much higher than any other blood sugar rise seen throughout the day, even for normal people, a point that the professor stresses in his presentation. So throw out the Corn Flakes!


7 comments:
Do you know what the high carb meal consisted of? Depending on the type and amounts of carb I would think you'd get different responses!
Cindy,
The food intake was all the different things that the 24 subjects chose to eat when they were home, but still hooked up to the monitor. All they were told was that they had to eat at a specific time so that they could know what corresponded to the monitor readings.
I am finding with my own response to Januvia that the exquisite relationship between grams of carbs in and blood sugar up dissappears when insulin is secreted as part of the normal physiological response to rising blood sugar.
My Sweetie, who is normal, can eat any amount of carbs and only rise to 115 mg/dl.
So it may well be that the dose/spike relationship is really a sign of defective insulin secretion.
Thanks for the info Jenny. I figured they'd tell them what to eat, to make sure all got the same dose.
Personally, I'm very sentitive, but not even considered Pre-diabetic. I show hypoglycemia on a 4h GTT, but A1c is normal.
Anna,
I got your comment, but it really seemed like a discussion that should be in a private email and it requires a longer reply so if you email me I'll respond to your concerns.
I've also noticed I peak at 45 minutes. If I test even 15 minutes later I've missed the high reading and may even be back under 100.
My fasting blood sugar tends to run around 90, sometimes as high as 95.
I found some of the information in this study of particular interest.
Blood glucose in the fasting blood glucose state and basal glucose after recovery from food ingestion was approximately 80 mg/dl (4.4 mmol/L).
The implication is that postprandial glucose levels in normal glycemics
have to average range between xxx and xxx mg/dl (x.x and x.x mmol/L) in order to have HbA1c measures between 4.7 and 5%. (Plug in the x values if you know the effect of insulin and incretins).The C-peptide in these normals was 1.8 units of measure (range 0.9-2.7). C-peptide is co-secreted with insulin and is sometimes used as a proxy for insulin secretion.
One slide showed the percentage of the day at <60, 60-100, 100-120, etc. This is misleading in that part of the range 60-100 is fasting-basal and part of it was postprandial. The higher ranges reflect postprandial measures for healthy subjects. Fasting-basal was in the 70-90 range in the healthy subjects, but average closer to 80 mg/dl.
Hi Jenny:
You showed two different formulas for computing average blood glucose relative to A1c percentage as well as a link for making the computation that most agreed with your own results. I lost the link to the computation and your blog that showed the comparative methods. Could you send me an e-mail with this info. Also how does this fit with the idea of a postprandial estimate, i.e., Monnier et al.
Strategies in Normalizing Glycemia: The Pathophysiologic Basis - http://www.medscape.com/viewarticle/552878 The graph on the right side shows the incretin effect on C-peptide in healthy subjects. It was about 0.4 nmol/L before eating and 1.8 nmol/L at it's peak after eating.
See Slide 32. The Incretin Effect in Healthy Subjects.
Dear Anonymous,
How the heck am I supposed to send you an email????
People, please use the profile link for private emails. Posting a comment does not include any email information.
Post a Comment